Being featured in David Green’s “Best HR & People Analytics Articles” newsletter inspired me to put together a quick-and-dirty SNA based on the co-occurrence of people mentioned across all 60 editions, from April 2021 to March 2026.
IMO, it nicely illustrates David’s ongoing and successful effort to bring together a remarkably wide and diverse pool of People Analytics professionals from around the globe - and yes, with some “heavyweights” sitting right in the middle of the network, but that’s how real-world networks work, right? 😉
If you’d like to explore it yourself, here it is.
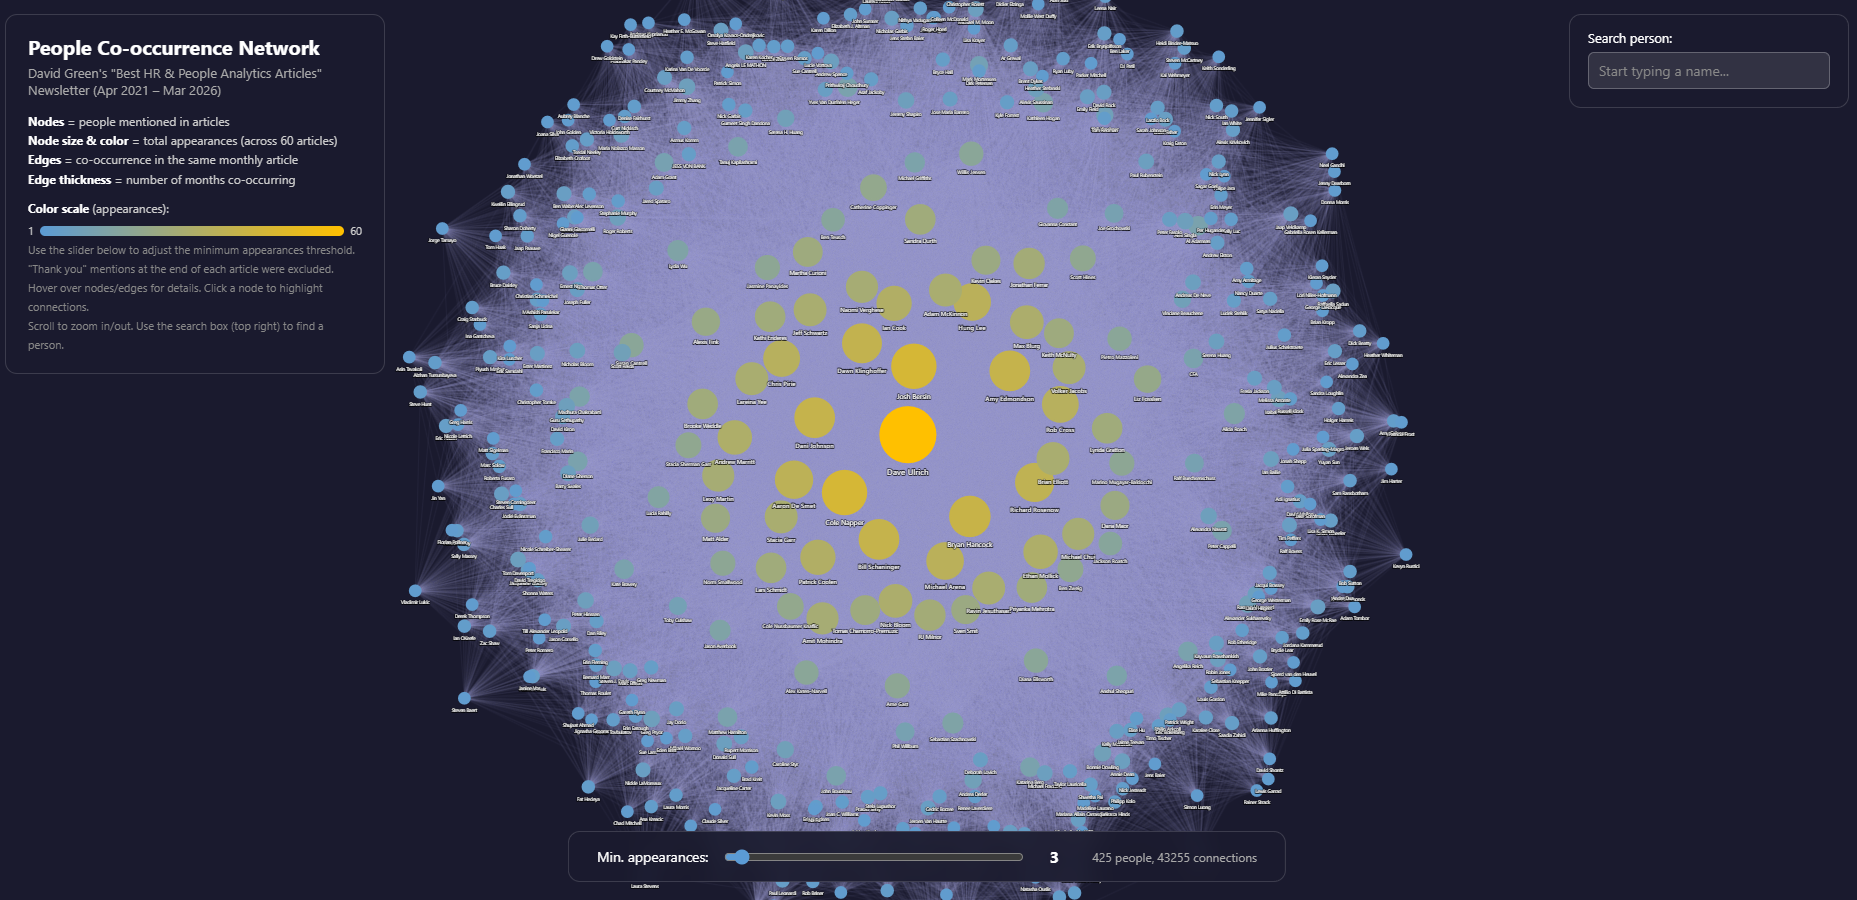
A few tips for navigating the network:
- Nodes = people mentioned in articles; node size & color reflect total appearances across 60 articles
- Edges = co-occurrence in the same monthly article; edge thickness = number of months co-occurring
- Use the slider to adjust the minimum appearances threshold
- Hover over nodes/edges for details; click a node to highlight its connections
- Scroll to zoom in/out; use the search box (top right) to find a specific person
P.S. You can consider this a prequel to the People Analytics Network Census (PANC), which is about to wrap up its second wave. If you haven’t participated yet, sign up here 🙂
Related notes
- Analyzing LinkedIn connections’ jobs using LLMs and the BERTopic package
- When facial similarity meets Network Science
- R Shiny app for LinkedIn connections analysis
- Induced centralities
- Using network graph modeling to capture overarching thematic clusters in employee comments
📄 Read the original post with full outputs on my blog.