This gap in the conversation provides a great opportunity to try out a causal inference method from the CausalPy package, specifically, the synthetic control method (with the caveat that its implementation is still a wip, so the outputs should be taken with a grain of salt). Generally, this technique constructs a weighted combination of control units to mimic the characteristics of a treated unit, enabling us to estimate the causal effect of an intervention without a traditional control group.
For the analysis, I looked at the combined GDP of 20 eurozone countries from 2007 to 2023 as the outcome of interest. To construct the synthetic control group for counterfactual comparison, I used GDP data from selected OECD countries (non-EU, non-eurozone, non-UK) over the same period.
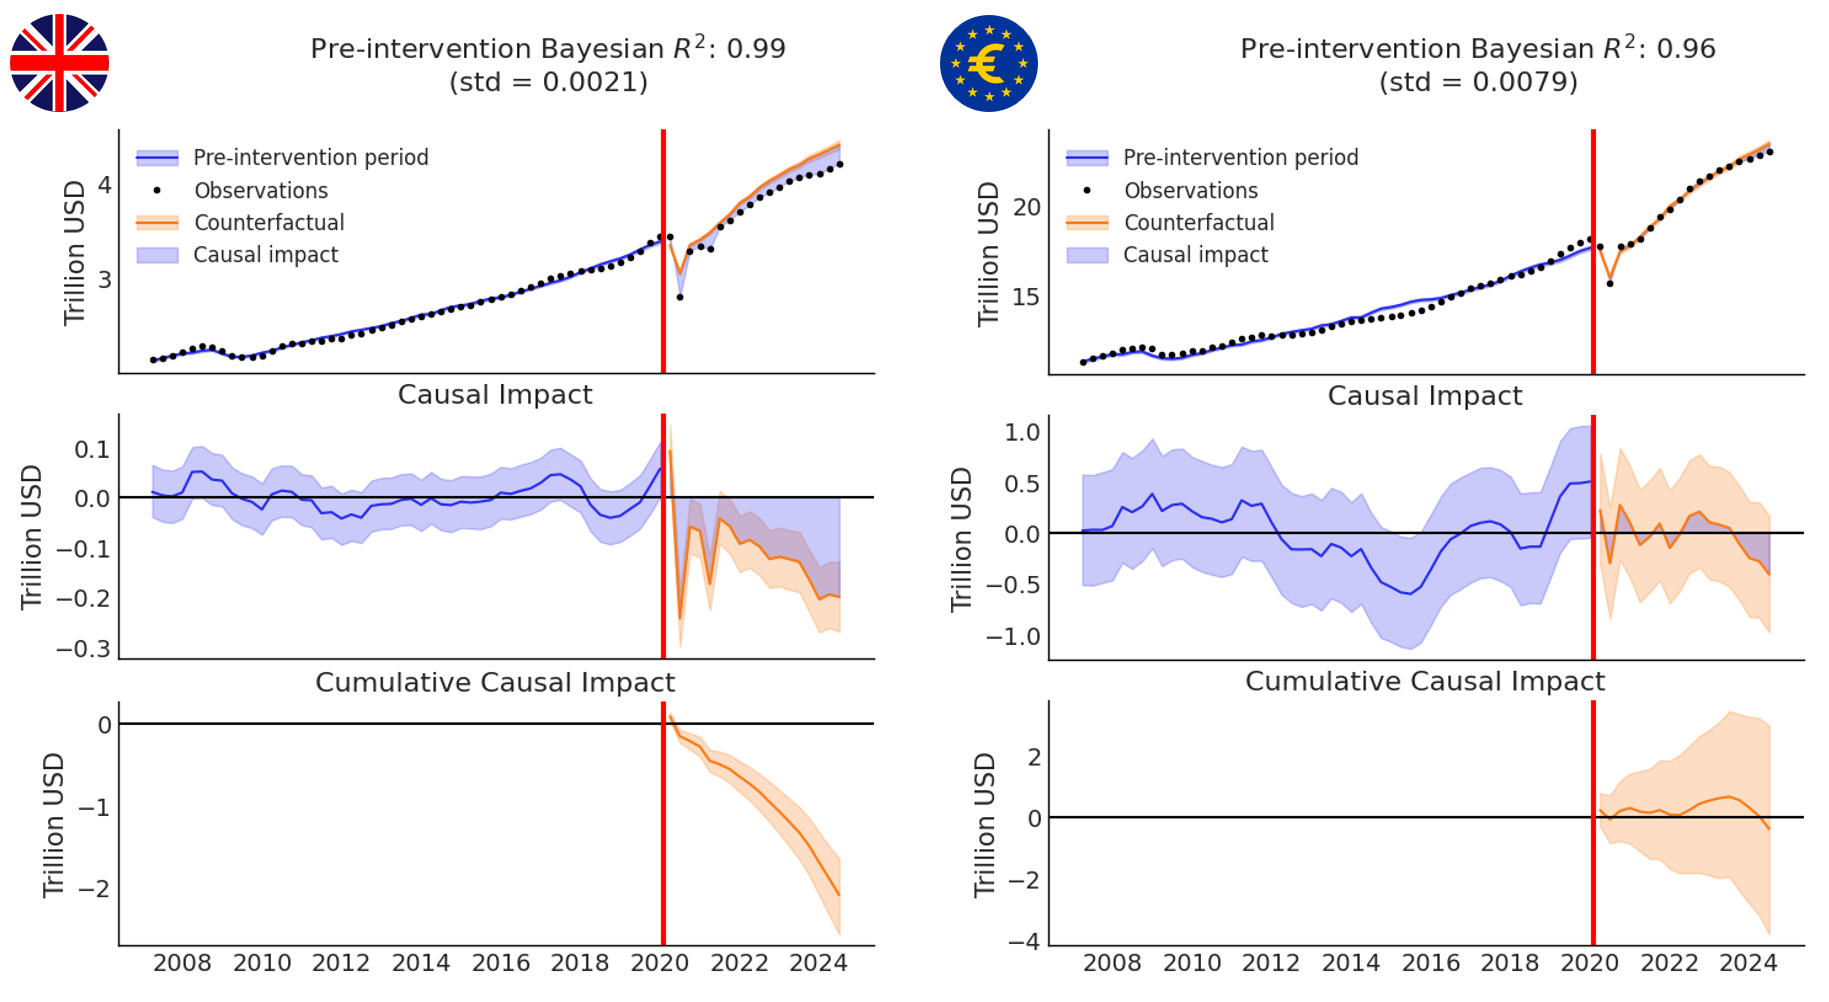
To my surprise, the results for the eurozone countries contrast pretty starkly with those for the UK (see the charts above). There doesn’t seem to be strong evidence of a significant negative impact from Brexit on eurozone GDP. Of course, this is just one facet of Brexit’s potential effects. There may be many other consequences - beyond what GDP metrics reveal - that apply to the eurozone as well. Still, it’s interesting to observe such a stark difference using the same type of data and methodology.
Maybe it reflects what we often see in personal relationships: divorce usually affects both sides, but the costs are only rarely distributed equally and/or in the same ways 🤔
P.S. If interested, the data from the OECD Data Explorer and the code for replicating this analysis are provided below.
# reticulate library for running Python in .Rmd file
library(reticulate)
# libraries for data manipulation and visualization
library(tidyverse)
library(DT)

# uploading the data from the OECD Data Explorer at https://data-explorer.oecd.org/
df <- readr::read_csv("oecd_data.csv")

# table view of two rows of the data
DT::datatable(
  df,
  class = 'cell-border stripe',
  filter = 'top',
  extensions = 'Buttons',
  fillContainer = FALSE,
  rownames= FALSE,
  options = list(
    pageLength = 2,
    autoWidth = TRUE,
    dom = 'Bfrtip',
    buttons = c('copy', 'csv', 'excel'),
    buttons = c('copy'),
    scrollX = TRUE,
    selection="multiple"
  )
)
Showing 20 of 3,968 rows and all 48 columns. View the full interactive table in the original post.
| STRUCTURE | STRUCTURE_ID | STRUCTURE_NAME | ACTION | FREQ | Frequency of observation | ADJUSTMENT | Adjustment | REF_AREA | Reference area | SECTOR | Institutional sector | COUNTERPART_SECTOR | Counterpart institutional sector | TRANSACTION | Transaction | INSTR_ASSET | Financial instruments and non-financial assets | ACTIVITY | Economic activity | EXPENDITURE | Expenditure | UNIT_MEASURE | Unit of measure | PRICE_BASE | Price base | TRANSFORMATION | Transformation | TABLE_IDENTIFIER | Table identifier | TIME_PERIOD | Time period | OBS_VALUE | Observation value | REF_YEAR_PRICE | Price reference year | BASE_PER | Base period | CONF_STATUS | Confidentiality status | DECIMALS | Decimals | OBS_STATUS | Observation status | UNIT_MULT | Unit multiplier | CURRENCY | Currency |
|---|---|---|---|---|---|---|---|---|---|---|---|---|---|---|---|---|---|---|---|---|---|---|---|---|---|---|---|---|---|---|---|---|---|---|---|---|---|---|---|---|---|---|---|---|---|---|---|
| DATAFLOW | OECD.SDD.NAD:DSD_NAMAIN1@DF_QNA_EXPENDITURE_USD(1.1) | Quarterly GDP and components - expenditure approach, US Dollars | I | Q | Quarterly | Y | Calendar and seasonally adjusted | TUR | Türkiye | S1 | Total economy | S1 | Total economy | B1GQ | Gross domestic product | _Z | Not applicable | _Z | Not applicable | _Z | Not applicable | USD_PPP | US dollars, PPP converted | V | Current prices | LA | Annual levels | T0102 | Table 0102 - GDP identity from the expenditure side | 2020-Q2 | 2128318.1 | False | Free (free for publication) | 1 | One | A | Normal value | 6 | Millions | USD | US dollar | ||||||
| DATAFLOW | OECD.SDD.NAD:DSD_NAMAIN1@DF_QNA_EXPENDITURE_USD(1.1) | Quarterly GDP and components - expenditure approach, US Dollars | I | Q | Quarterly | Y | Calendar and seasonally adjusted | EA20 | Euro area (20 countries) | S1 | Total economy | S1 | Total economy | B1GQ | Gross domestic product | _Z | Not applicable | _Z | Not applicable | _Z | Not applicable | USD_PPP | US dollars, PPP converted | V | Current prices | LA | Annual levels | T0102 | Table 0102 - GDP identity from the expenditure side | 2013-Q2 | 13306591.6 | False | Free (free for publication) | 1 | One | A | Normal value | 6 | Millions | USD | US dollar | ||||||
| DATAFLOW | OECD.SDD.NAD:DSD_NAMAIN1@DF_QNA_EXPENDITURE_USD(1.1) | Quarterly GDP and components - expenditure approach, US Dollars | I | Q | Quarterly | Y | Calendar and seasonally adjusted | EA20 | Euro area (20 countries) | S1 | Total economy | S1 | Total economy | B1GQ | Gross domestic product | _Z | Not applicable | _Z | Not applicable | _Z | Not applicable | USD_PPP | US dollars, PPP converted | V | Current prices | LA | Annual levels | T0102 | Table 0102 - GDP identity from the expenditure side | 2013-Q3 | 13451259.5 | False | Free (free for publication) | 1 | One | A | Normal value | 6 | Millions | USD | US dollar | ||||||
| DATAFLOW | OECD.SDD.NAD:DSD_NAMAIN1@DF_QNA_EXPENDITURE_USD(1.1) | Quarterly GDP and components - expenditure approach, US Dollars | I | Q | Quarterly | Y | Calendar and seasonally adjusted | NOR | Norway | S1 | Total economy | S1 | Total economy | B1GQ | Gross domestic product | _Z | Not applicable | _Z | Not applicable | _Z | Not applicable | USD_PPP | US dollars, PPP converted | V | Current prices | LA | Annual levels | T0102 | Table 0102 - GDP identity from the expenditure side | 2017-Q2 | 338596.8 | False | Free (free for publication) | 1 | One | A | Normal value | 6 | Millions | USD | US dollar | ||||||
| DATAFLOW | OECD.SDD.NAD:DSD_NAMAIN1@DF_QNA_EXPENDITURE_USD(1.1) | Quarterly GDP and components - expenditure approach, US Dollars | I | Q | Quarterly | Y | Calendar and seasonally adjusted | EA20 | Euro area (20 countries) | S1 | Total economy | S1 | Total economy | B1GQ | Gross domestic product | _Z | Not applicable | _Z | Not applicable | _Z | Not applicable | USD_PPP | US dollars, PPP converted | V | Current prices | LA | Annual levels | T0102 | Table 0102 - GDP identity from the expenditure side | 2007-Q3 | 11664361.8 | False | Free (free for publication) | 1 | One | A | Normal value | 6 | Millions | USD | US dollar | ||||||
| DATAFLOW | OECD.SDD.NAD:DSD_NAMAIN1@DF_QNA_EXPENDITURE_USD(1.1) | Quarterly GDP and components - expenditure approach, US Dollars | I | Q | Quarterly | Y | Calendar and seasonally adjusted | EA20 | Euro area (20 countries) | S1 | Total economy | S1 | Total economy | B1GQ | Gross domestic product | _Z | Not applicable | _Z | Not applicable | _Z | Not applicable | USD_PPP | US dollars, PPP converted | V | Current prices | LA | Annual levels | T0102 | Table 0102 - GDP identity from the expenditure side | 2007-Q4 | 11825294.7 | False | Free (free for publication) | 1 | One | A | Normal value | 6 | Millions | USD | US dollar | ||||||
| DATAFLOW | OECD.SDD.NAD:DSD_NAMAIN1@DF_QNA_EXPENDITURE_USD(1.1) | Quarterly GDP and components - expenditure approach, US Dollars | I | Q | Quarterly | Y | Calendar and seasonally adjusted | EA20 | Euro area (20 countries) | S1 | Total economy | S1 | Total economy | B1GQ | Gross domestic product | _Z | Not applicable | _Z | Not applicable | _Z | Not applicable | USD_PPP | US dollars, PPP converted | V | Current prices | LA | Annual levels | T0102 | Table 0102 - GDP identity from the expenditure side | 2008-Q1 | 12009899.7 | False | Free (free for publication) | 1 | One | A | Normal value | 6 | Millions | USD | US dollar | ||||||
| DATAFLOW | OECD.SDD.NAD:DSD_NAMAIN1@DF_QNA_EXPENDITURE_USD(1.1) | Quarterly GDP and components - expenditure approach, US Dollars | I | Q | Quarterly | Y | Calendar and seasonally adjusted | EA20 | Euro area (20 countries) | S1 | Total economy | S1 | Total economy | B1GQ | Gross domestic product | _Z | Not applicable | _Z | Not applicable | _Z | Not applicable | USD_PPP | US dollars, PPP converted | V | Current prices | LA | Annual levels | T0102 | Table 0102 - GDP identity from the expenditure side | 2008-Q2 | 12086395.2 | False | Free (free for publication) | 1 | One | A | Normal value | 6 | Millions | USD | US dollar | ||||||
| DATAFLOW | OECD.SDD.NAD:DSD_NAMAIN1@DF_QNA_EXPENDITURE_USD(1.1) | Quarterly GDP and components - expenditure approach, US Dollars | I | Q | Quarterly | Y | Calendar and seasonally adjusted | EA20 | Euro area (20 countries) | S1 | Total economy | S1 | Total economy | B1GQ | Gross domestic product | _Z | Not applicable | _Z | Not applicable | _Z | Not applicable | USD_PPP | US dollars, PPP converted | V | Current prices | LA | Annual levels | T0102 | Table 0102 - GDP identity from the expenditure side | 2008-Q3 | 12171946.9 | False | Free (free for publication) | 1 | One | A | Normal value | 6 | Millions | USD | US dollar | ||||||
| DATAFLOW | OECD.SDD.NAD:DSD_NAMAIN1@DF_QNA_EXPENDITURE_USD(1.1) | Quarterly GDP and components - expenditure approach, US Dollars | I | Q | Quarterly | Y | Calendar and seasonally adjusted | EA20 | Euro area (20 countries) | S1 | Total economy | S1 | Total economy | B1GQ | Gross domestic product | _Z | Not applicable | _Z | Not applicable | _Z | Not applicable | USD_PPP | US dollars, PPP converted | V | Current prices | LA | Annual levels | T0102 | Table 0102 - GDP identity from the expenditure side | 2008-Q4 | 12064306.4 | False | Free (free for publication) | 1 | One | A | Normal value | 6 | Millions | USD | US dollar | ||||||
| DATAFLOW | OECD.SDD.NAD:DSD_NAMAIN1@DF_QNA_EXPENDITURE_USD(1.1) | Quarterly GDP and components - expenditure approach, US Dollars | I | Q | Quarterly | Y | Calendar and seasonally adjusted | EA20 | Euro area (20 countries) | S1 | Total economy | S1 | Total economy | B1GQ | Gross domestic product | _Z | Not applicable | _Z | Not applicable | _Z | Not applicable | USD_PPP | US dollars, PPP converted | V | Current prices | LA | Annual levels | T0102 | Table 0102 - GDP identity from the expenditure side | 2012-Q4 | 13005144.7 | False | Free (free for publication) | 1 | One | A | Normal value | 6 | Millions | USD | US dollar | ||||||
| DATAFLOW | OECD.SDD.NAD:DSD_NAMAIN1@DF_QNA_EXPENDITURE_USD(1.1) | Quarterly GDP and components - expenditure approach, US Dollars | I | Q | Quarterly | Y | Calendar and seasonally adjusted | LTU | Lithuania | S1 | Total economy | S1 | Total economy | B1GQ | Gross domestic product | _Z | Not applicable | _Z | Not applicable | _Z | Not applicable | USD_PPP | US dollars, PPP converted | V | Current prices | LA | Annual levels | T0102 | Table 0102 - GDP identity from the expenditure side | 2020-Q2 | 109874.3 | False | Free (free for publication) | 1 | One | A | Normal value | 6 | Millions | USD | US dollar | ||||||
| DATAFLOW | OECD.SDD.NAD:DSD_NAMAIN1@DF_QNA_EXPENDITURE_USD(1.1) | Quarterly GDP and components - expenditure approach, US Dollars | I | Q | Quarterly | Y | Calendar and seasonally adjusted | EA20 | Euro area (20 countries) | S1 | Total economy | S1 | Total economy | B1GQ | Gross domestic product | _Z | Not applicable | _Z | Not applicable | _Z | Not applicable | USD_PPP | US dollars, PPP converted | V | Current prices | LA | Annual levels | T0102 | Table 0102 - GDP identity from the expenditure side | 2010-Q2 | 12127749.2 | False | Free (free for publication) | 1 | One | A | Normal value | 6 | Millions | USD | US dollar | ||||||
| DATAFLOW | OECD.SDD.NAD:DSD_NAMAIN1@DF_QNA_EXPENDITURE_USD(1.1) | Quarterly GDP and components - expenditure approach, US Dollars | I | Q | Quarterly | Y | Calendar and seasonally adjusted | EA20 | Euro area (20 countries) | S1 | Total economy | S1 | Total economy | B1GQ | Gross domestic product | _Z | Not applicable | _Z | Not applicable | _Z | Not applicable | USD_PPP | US dollars, PPP converted | V | Current prices | LA | Annual levels | T0102 | Table 0102 - GDP identity from the expenditure side | 2010-Q3 | 12227268 | False | Free (free for publication) | 1 | One | A | Normal value | 6 | Millions | USD | US dollar | ||||||
| DATAFLOW | OECD.SDD.NAD:DSD_NAMAIN1@DF_QNA_EXPENDITURE_USD(1.1) | Quarterly GDP and components - expenditure approach, US Dollars | I | Q | Quarterly | Y | Calendar and seasonally adjusted | EA20 | Euro area (20 countries) | S1 | Total economy | S1 | Total economy | B1GQ | Gross domestic product | _Z | Not applicable | _Z | Not applicable | _Z | Not applicable | USD_PPP | US dollars, PPP converted | V | Current prices | LA | Annual levels | T0102 | Table 0102 - GDP identity from the expenditure side | 2010-Q4 | 12395836.1 | False | Free (free for publication) | 1 | One | A | Normal value | 6 | Millions | USD | US dollar | ||||||
| DATAFLOW | OECD.SDD.NAD:DSD_NAMAIN1@DF_QNA_EXPENDITURE_USD(1.1) | Quarterly GDP and components - expenditure approach, US Dollars | I | Q | Quarterly | Y | Calendar and seasonally adjusted | EA20 | Euro area (20 countries) | S1 | Total economy | S1 | Total economy | B1GQ | Gross domestic product | _Z | Not applicable | _Z | Not applicable | _Z | Not applicable | USD_PPP | US dollars, PPP converted | V | Current prices | LA | Annual levels | T0102 | Table 0102 - GDP identity from the expenditure side | 2011-Q1 | 12618512.2 | False | Free (free for publication) | 1 | One | A | Normal value | 6 | Millions | USD | US dollar | ||||||
| DATAFLOW | OECD.SDD.NAD:DSD_NAMAIN1@DF_QNA_EXPENDITURE_USD(1.1) | Quarterly GDP and components - expenditure approach, US Dollars | I | Q | Quarterly | Y | Calendar and seasonally adjusted | EA20 | Euro area (20 countries) | S1 | Total economy | S1 | Total economy | B1GQ | Gross domestic product | _Z | Not applicable | _Z | Not applicable | _Z | Not applicable | USD_PPP | US dollars, PPP converted | V | Current prices | LA | Annual levels | T0102 | Table 0102 - GDP identity from the expenditure side | 2011-Q2 | 12729609.1 | False | Free (free for publication) | 1 | One | A | Normal value | 6 | Millions | USD | US dollar | ||||||
| DATAFLOW | OECD.SDD.NAD:DSD_NAMAIN1@DF_QNA_EXPENDITURE_USD(1.1) | Quarterly GDP and components - expenditure approach, US Dollars | I | Q | Quarterly | Y | Calendar and seasonally adjusted | EA20 | Euro area (20 countries) | S1 | Total economy | S1 | Total economy | B1GQ | Gross domestic product | _Z | Not applicable | _Z | Not applicable | _Z | Not applicable | USD_PPP | US dollars, PPP converted | V | Current prices | LA | Annual levels | T0102 | Table 0102 - GDP identity from the expenditure side | 2011-Q3 | 12820502.9 | False | Free (free for publication) | 1 | One | A | Normal value | 6 | Millions | USD | US dollar | ||||||
| DATAFLOW | OECD.SDD.NAD:DSD_NAMAIN1@DF_QNA_EXPENDITURE_USD(1.1) | Quarterly GDP and components - expenditure approach, US Dollars | I | Q | Quarterly | Y | Calendar and seasonally adjusted | EA20 | Euro area (20 countries) | S1 | Total economy | S1 | Total economy | B1GQ | Gross domestic product | _Z | Not applicable | _Z | Not applicable | _Z | Not applicable | USD_PPP | US dollars, PPP converted | V | Current prices | LA | Annual levels | T0102 | Table 0102 - GDP identity from the expenditure side | 2011-Q4 | 12797395.4 | False | Free (free for publication) | 1 | One | A | Normal value | 6 | Millions | USD | US dollar | ||||||
| DATAFLOW | OECD.SDD.NAD:DSD_NAMAIN1@DF_QNA_EXPENDITURE_USD(1.1) | Quarterly GDP and components - expenditure approach, US Dollars | I | Q | Quarterly | Y | Calendar and seasonally adjusted | EA20 | Euro area (20 countries) | S1 | Total economy | S1 | Total economy | B1GQ | Gross domestic product | _Z | Not applicable | _Z | Not applicable | _Z | Not applicable | USD_PPP | US dollars, PPP converted | V | Current prices | LA | Annual levels | T0102 | Table 0102 - GDP identity from the expenditure side | 2012-Q1 | 12817163.5 | False | Free (free for publication) | 1 | One | A | Normal value | 6 | Millions | USD | US dollar |
# uploading libraries for data manipulation, visualization, and causal inference
import numpy as np
import pandas as pd
import matplotlib.pyplot as plt
import arviz as az
import causalpy as cp
az.style.use("arviz-white")

# uploading the data from the OECD Data Explorer at https://data-explorer.oecd.org/
data = pd.read_csv('oecd_data.csv')
data.info()
data.head()

# keeping only relevant variables
data = data[[
    'Reference area',
    'TIME_PERIOD',
    'OBS_VALUE'
]]

# cleaning the quarter column
# function to calculate the last day of the quarter
def quarter_to_date(q):
    year, quarter = q.split('-')
    quarter_month_map = {
        'Q1': '03-31',
        'Q2': '06-30',
        'Q3': '09-30',
        'Q4': '12-31'
    }
    return f"{year}-{quarter_month_map[quarter]}"

data['TIME_PERIOD'] = data['TIME_PERIOD'].apply(quarter_to_date)
data['TIME_PERIOD'] = pd.to_datetime(data['TIME_PERIOD'], format='%Y-%m-%d')

# cleaning the country names
data['Reference area'] = data['Reference area'].str.replace('- ', '', regex=True).str.replace(' ', '_', regex=True).str.replace(r'[()]', '', regex=True)

# putting data on the trillion/billion (10^12) unit scale
data['OBS_VALUE'] = data['OBS_VALUE']/1000000

# getting data from long to wide format
melted_df = data.melt(id_vars=['Reference area', 'TIME_PERIOD'], var_name='Variable', value_name='Value')
pivoted_df = melted_df.pivot(index='TIME_PERIOD', columns='Reference area', values='Value')
pivoted_df.info()

# removing countries with missing values in the time series data
pivoted_df.drop(columns=['Saudi_Arabia', 'Russia'], inplace=True)

# removing row for date where we have data for only one country
pivoted_df = pivoted_df[pivoted_df.index != pd.to_datetime('2024-09-30')]

# identifying countries (that didn't left EU) GDP of which most strongly correlated with UK's GDP before actual Brexit (2020 January 31)
correlation_df = pivoted_df[pivoted_df.index <= pd.to_datetime("2020 January 31")].corr()
print(correlation_df[['United_Kingdom']].drop('United_Kingdom').sort_values(by='United_Kingdom', ascending=False))


# Analysis 1: The impact of Brexit on UK GDP

# target country of interest
target_country = 'United_Kingdom'
# control countries (top 15)
other_countries = [
    "United_States",
    "Costa_Rica",
    "Germany",
    "New_Zealand",
    "Sweden",
    "Austria",
    "Luxembourg",
    "Denmark",
    "Belgium",
    "Korea",
    "Canada",
    "Lithuania",
    "France",
    "India",
    "Estonia"
]

# formula
formula = target_country + " ~ " + "0 + " + " + ".join(other_countries)
print(formula)

# modeling data preparation
treatment_time = pd.to_datetime("2020 January 31")
modeling_data = pivoted_df.copy()
modeling_data = modeling_data[[target_country] + other_countries]
modeling_data.dropna(axis='rows', inplace=True, how='all')

# fitting the model
result = cp.SyntheticControl(
    modeling_data,
    treatment_time,
    formula=formula,
    model=cp.pymc_models.WeightedSumFitter(
        sample_kwargs={
        "random_seed": 2024,
        "draws": 10000,
        "tune": 5000,
        "target_accept": 0.99,
        "chains": 4
      }
    )
)

# results summary
az.summary(result.idata, var_names=["~mu"])

# visualization of the posterior samples
az.plot_trace(result.idata, var_names="~mu", compact=False)
plt.show()

# visualization of the estimated causal effect
fig, ax = result.plot(plot_predictors=False)
for i in [0, 1, 2]:
    ax[i].set(ylabel="Trillion USD")
plt.show()


# Analysis 2: The impact of Brexit on the GDP of eurozone countries

# identifying countries (non-EU, non-eurozone, non-UK) GDP of which most strongly correlated with eurozone countries' GDP before actual Brexit (2020 January 31)
correlation_df = pivoted_df[pivoted_df.index <= pd.to_datetime("2020 January 31")].corr()
print(correlation_df[['Euro_area_20_countries']].drop('Euro_area_20_countries').sort_values(by='Euro_area_20_countries', ascending=False))

# target country of interest
target_country = 'Euro_area_20_countries'
# control countries (top 12)
other_countries = [
    "Costa_Rica",
    "New_Zealand",
    "United_States",
    "India",
    "Korea",
    "Colombia",
    "Canada",
    "Israel",
    "Iceland",
    "Switzerland",
    "Indonesia",
    "Australia"
]

# formula
formula = target_country + " ~ " + "0 + " + " + ".join(other_countries)
print(formula)

# modeling data preparation
treatment_time = pd.to_datetime("2020 January 31")
modeling_data = pivoted_df.copy()
modeling_data = modeling_data[[target_country] + other_countries]
modeling_data.dropna(axis='rows', inplace=True, how='all')

# fitting the model
result = cp.SyntheticControl(
    modeling_data,
    treatment_time,
    formula=formula,
    model=cp.pymc_models.WeightedSumFitter(
        sample_kwargs={
        "random_seed": 2024,
        "draws": 10000,
        "tune": 5000,
        "target_accept": 0.99,
        "chains": 4
      }
    )
)

# results summary
az.summary(result.idata, var_names=["~mu"])

# visualization of the posterior samples
az.plot_trace(result.idata, var_names="~mu", compact=False)
plt.show()

# visualization of the estimated causal effect
fig, ax = result.plot(plot_predictors=False)
for i in [0, 1, 2]:
    ax[i].set(ylabel="Trillion USD")
plt.show()
Related notes
- Beyond prediction: Exploiting organizational events for causal inference in people analytics
- Modeling impact of the COVID-19 pandemic on people’s interest in work-life balance and well-being
- Did the Nobel Prize put causal inference on the public radar?
- The impact of the COVID pandemic on the popularity of people analytics
- What a European cigarette tax study taught me about employee listening
📄 Read the original post with full outputs on my blog.